Customize the Settings
Here's a breakdown of the indicator settings and how you can customize them. But listen up: we've spent countless hours optimizing the default settings for peak performance. So, before you go messing with things, make absolutely sure you know what you're doing. Changing these settings without a solid understanding could seriously mess with the indicator's accuracy and effectiveness. Consider yourself warned. If you still choose to proceed, you're on your own.
Our optimal default settings are saved in Discord: https://discord.gg/Nk4Y37Z8WB
Visualization Settings
1
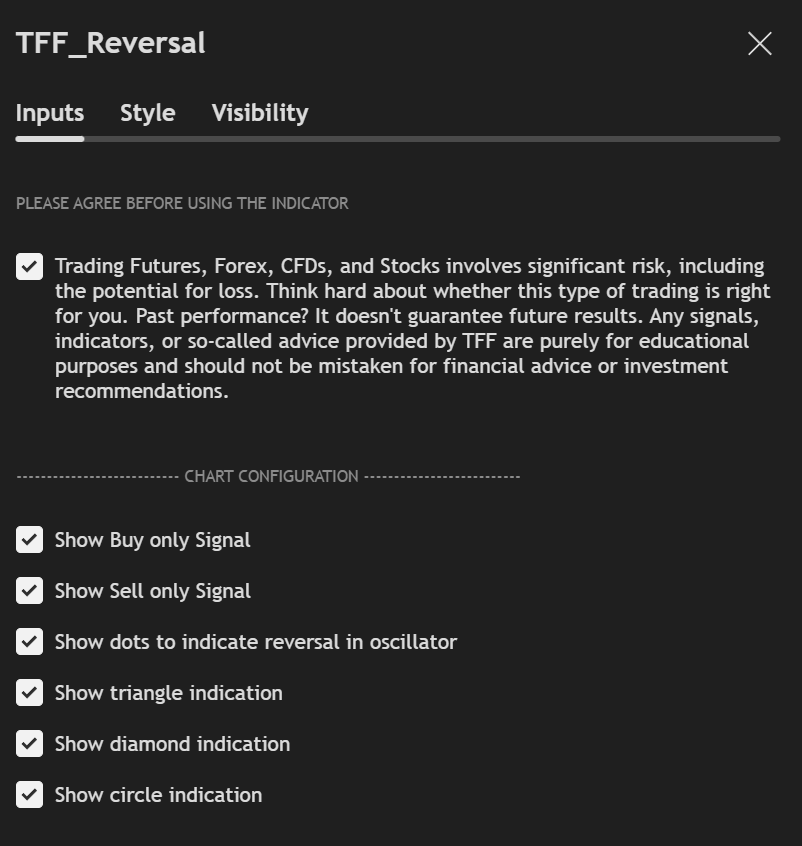
The indicator won't work until you check the terms and conditions box. If you close the window without ticking it, just remove and re-add the indicator.
2
If you know what you're doing, you can filter the signals to show only buys or sells, based on the bigger picture (higher timeframe trend or daily bias).
3
You have the option to select which of the four signals—dot, triangle, diamond or cicle to displayed on your chart. This allows you to customize your view and eliminate unnecessary distractions.
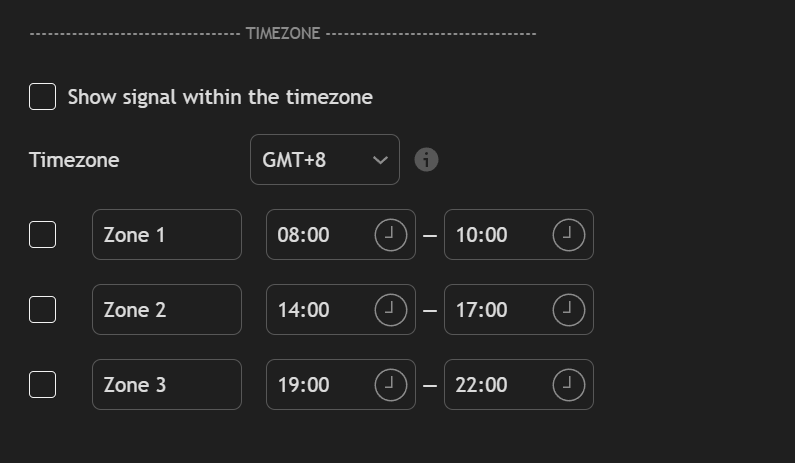
Timezone Settings
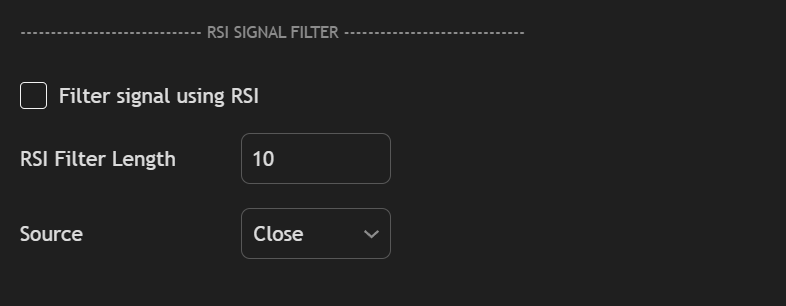
RSI Filter
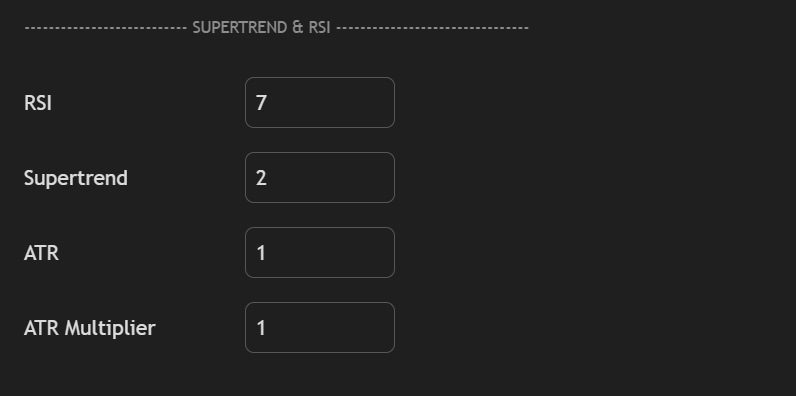
Supertrend RSI Settings
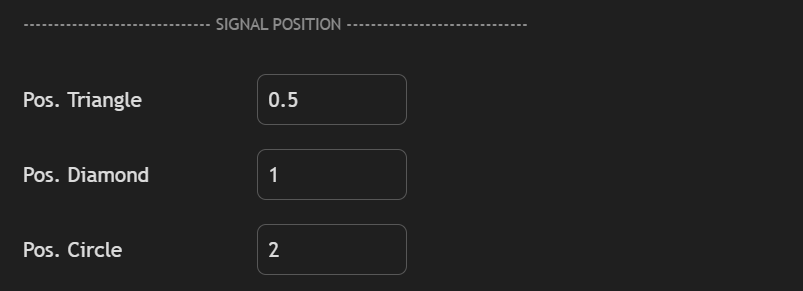
Signal Positioning
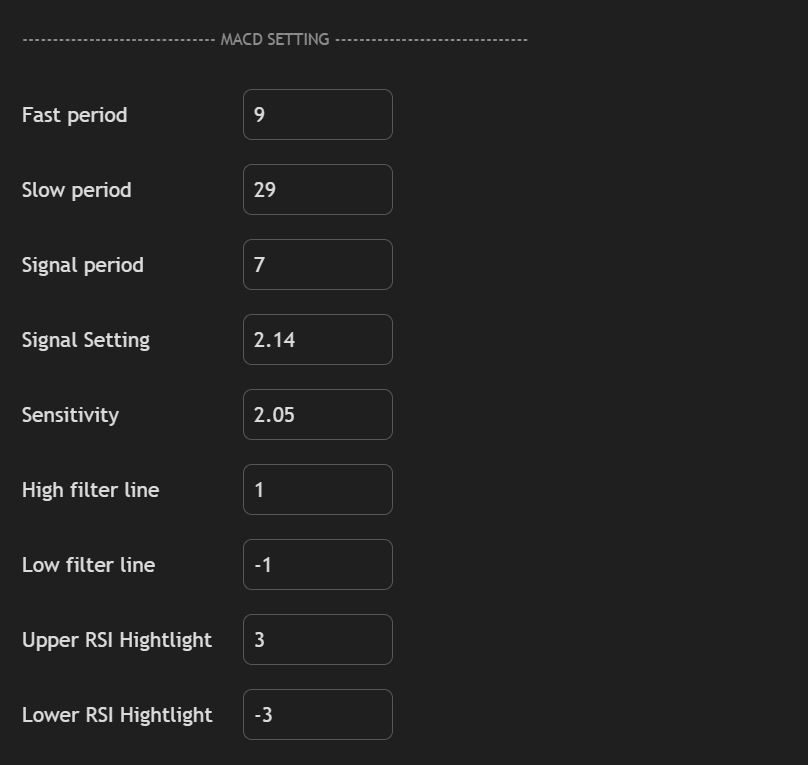
MACD Settings